|
CLS Cell Lines Service GmbH
llc pk1  Llc Pk1, supplied by CLS Cell Lines Service GmbH, used in various techniques. Bioz Stars score: 90/100, based on 1 PubMed citations. ZERO BIAS - scores, article reviews, protocol conditions and more https://www.bioz.com/product/llc+cells/pmc06635507-161-0-1?v=CLS+Cell+Lines+Service+GmbH Average 90 stars, based on 1 article reviews
llc pk1 - by Bioz Stars,
2026-07
90/100 stars
|
Buy from Supplier |
|
Danaher Inc
confocal microscope  Confocal Microscope, supplied by Danaher Inc, used in various techniques. Bioz Stars score: 96/100, based on 1 PubMed citations. ZERO BIAS - scores, article reviews, protocol conditions and more https://www.bioz.com/product/llc+cells/pmc12344487-57-14-18?v=Danaher+Inc Average 96 stars, based on 1 article reviews
confocal microscope - by Bioz Stars,
2026-07
96/100 stars
|
Buy from Supplier |
|
Transnetyx
tail tissue Tail Tissue, supplied by Transnetyx, used in various techniques. Bioz Stars score: 97/100, based on 1 PubMed citations. ZERO BIAS - scores, article reviews, protocol conditions and more https://www.bioz.com/product/llc+cells/bio_rxiv__64898__2026__03__13__711456-44-5-13?v=Transnetyx Average 97 stars, based on 1 article reviews
tail tissue - by Bioz Stars,
2026-07
97/100 stars
|
Buy from Supplier |
|
Molecular Devices LLC
cloneselect a g  Cloneselect A G, supplied by Molecular Devices LLC, used in various techniques. Bioz Stars score: 96/100, based on 1 PubMed citations. ZERO BIAS - scores, article reviews, protocol conditions and more https://www.bioz.com/product/llc+cells/bio_rxiv__2023__01__18__524633-41-5-5?v=Molecular+Devices+LLC Average 96 stars, based on 1 article reviews
cloneselect a g - by Bioz Stars,
2026-07
96/100 stars
|
Buy from Supplier |
|
Tymora Analytical Operations LLC
proteomics analysis Proteomics Analysis, supplied by Tymora Analytical Operations LLC, used in various techniques. Bioz Stars score: 95/100, based on 1 PubMed citations. ZERO BIAS - scores, article reviews, protocol conditions and more https://www.bioz.com/product/llc+cells/10__20517_slash_evcna__2023__57-686-0-7?v=Tymora+Analytical+Operations+LLC Average 95 stars, based on 1 article reviews
proteomics analysis - by Bioz Stars,
2026-07
95/100 stars
|
Buy from Supplier |
|
Qsonica LLC
probe sonicator microson ultrasonic cell disruptor model xl2005 Probe Sonicator Microson Ultrasonic Cell Disruptor Model Xl2005, supplied by Qsonica LLC, used in various techniques. Bioz Stars score: 90/100, based on 1 PubMed citations. ZERO BIAS - scores, article reviews, protocol conditions and more https://www.bioz.com/product/llc+cells/10__1016_slash_j__jff__2015__06__005-130-19-27?v=Qsonica+LLC Average 90 stars, based on 1 article reviews
probe sonicator microson ultrasonic cell disruptor model xl2005 - by Bioz Stars,
2026-07
90/100 stars
|
Buy from Supplier |
|
AllCells LLC
healthy bone marrow aspirates from iliac bone and peripheral blood mononuclear cells (pbmncs) Healthy Bone Marrow Aspirates From Iliac Bone And Peripheral Blood Mononuclear Cells (Pbmncs), supplied by AllCells LLC, used in various techniques. Bioz Stars score: 90/100, based on 1 PubMed citations. ZERO BIAS - scores, article reviews, protocol conditions and more https://www.bioz.com/product/llc+cells/pmc02873699-23-6-19?v=AllCells+LLC Average 90 stars, based on 1 article reviews
healthy bone marrow aspirates from iliac bone and peripheral blood mononuclear cells (pbmncs) - by Bioz Stars,
2026-07
90/100 stars
|
Buy from Supplier |
|
ChemAxon LLC
in cell 1000 In Cell 1000, supplied by ChemAxon LLC, used in various techniques. Bioz Stars score: 90/100, based on 1 PubMed citations. ZERO BIAS - scores, article reviews, protocol conditions and more https://www.bioz.com/product/llc+cells/pmc03191303-84-6-23?v=ChemAxon+LLC Average 90 stars, based on 1 article reviews
in cell 1000 - by Bioz Stars,
2026-07
90/100 stars
|
Buy from Supplier |
|
Biomodels LLC
collagen seeded with the of cells consisting of cardiomyocytes, endothelial cells, and mscs Collagen Seeded With The Of Cells Consisting Of Cardiomyocytes, Endothelial Cells, And Mscs, supplied by Biomodels LLC, used in various techniques. Bioz Stars score: 90/100, based on 1 PubMed citations. ZERO BIAS - scores, article reviews, protocol conditions and more https://www.bioz.com/product/llc+cells/us11696973-211-16-22?v=Biomodels+LLC Average 90 stars, based on 1 article reviews
collagen seeded with the of cells consisting of cardiomyocytes, endothelial cells, and mscs - by Bioz Stars,
2026-07
90/100 stars
|
Buy from Supplier |
|
MSE Supplies LLC
cell stack starting materials Cell Stack Starting Materials, supplied by MSE Supplies LLC, used in various techniques. Bioz Stars score: 90/100, based on 1 PubMed citations. ZERO BIAS - scores, article reviews, protocol conditions and more https://www.bioz.com/product/llc+cells/us11302961-433-1-19?v=MSE+Supplies+LLC Average 90 stars, based on 1 article reviews
cell stack starting materials - by Bioz Stars,
2026-07
90/100 stars
|
Buy from Supplier |
|
WholeGenome LLC
transcriptomic profiling by single-cell rna sequence Transcriptomic Profiling By Single Cell Rna Sequence, supplied by WholeGenome LLC, used in various techniques. Bioz Stars score: 90/100, based on 1 PubMed citations. ZERO BIAS - scores, article reviews, protocol conditions and more https://www.bioz.com/product/llc+cells/10__1161_slash_circresaha__122__321879-100-20-39?v=WholeGenome+LLC Average 90 stars, based on 1 article reviews
transcriptomic profiling by single-cell rna sequence - by Bioz Stars,
2026-07
90/100 stars
|
Buy from Supplier |
|
AllCells LLC
peripheral blood mononuclear cells from hiv negative caucasian male donors Peripheral Blood Mononuclear Cells From Hiv Negative Caucasian Male Donors, supplied by AllCells LLC, used in various techniques. Bioz Stars score: 90/100, based on 1 PubMed citations. ZERO BIAS - scores, article reviews, protocol conditions and more https://www.bioz.com/product/llc+cells/ppr0369942-128-0-13?v=AllCells+LLC Average 90 stars, based on 1 article reviews
peripheral blood mononuclear cells from hiv negative caucasian male donors - by Bioz Stars,
2026-07
90/100 stars
|
Buy from Supplier |
Image Search Results
Journal: Scientific Reports
Article Title: IFT88 controls NuMA enrichment at k-fibers minus-ends to facilitate their re-anchoring into mitotic spindles
doi: 10.1038/s41598-019-46605-x
Figure Lengend Snippet: IFT88 is recruited at k-fibers minus-ends after laser ablation and contributes to their re-anchoring into spindle. ( a ) Images from time-lapse microscopy of monopolar Emerald-IFT88 LLC-PK1 cells labelled for tubulin (SiR-Tubulin) before and after k-fiber laser ablation (upper panel). Hoechst live was used to identify k-fibers attached to chromosomes. Time post-ablation (s). α-tubulin, IFT88 and α-tubulin/IFT88 stainings (maximal intensity projection of 2 planes) show IFT88 accumulation at minus-end after laser ablation (white arrow). ( b ) Line scans representing α-tubulin and IFT88 fluorescence intensities measured from a to b along the yellow line shown in ( a ). ( c ) Western-blots showing the amount of IFT88 in GFP-α-tubulin LLC-PK1 cells transfected with control (CT) or IFT88 siRNA. α-tubulin: loading control. ( d ) Images from time-lapse microscopy of monopolar GFP-α-tubulin LLC-PK1 labelled for DNA (Hoechst live, red), to allow for k-fibers detection, in control (CT) and IFT88-depleted cells (left panels). Inverted contrast images of α-tubulin before and after k-fiber ablation (ablation site, red arrowhead) show a delay in k-fiber re-anchoring into spindle upon IFT88 depletion. Images were acquired every 3 s for 2 min. Time post-ablation (s). Single planes are shown. Insets: magnification of the ablated k-fibers, dashed boxes regions. Red boxes indicate k-fibers re-anchoring. ( e ) Quantification of the time (s) required for k-fiber re-anchoring into spindle after laser ablation in CT and IFT88-depleted cells. n ≥ 30 ablated k-fibers (1 ablated k-fiber per cell), 3 experiments. Mean +/− s.e.m ** P < 0.01 compared to control ( t test). Scale bars: 5 µm.
Article Snippet:
Techniques: Time-lapse Microscopy, Fluorescence, Western Blot, Transfection, Control

Journal: Scientific Reports
Article Title: IFT88 controls NuMA enrichment at k-fibers minus-ends to facilitate their re-anchoring into mitotic spindles
doi: 10.1038/s41598-019-46605-x
Figure Lengend Snippet: IFT88 interacts with NuMA and contributes to its enrichment at k-fibers minus-ends after laser ablation. ( a ) Inverted contrast and merged images from time-lapse microscopy of monopolar YFP-NuMA LLC-PK1 combined with MT labelling (SiR-Tubulin) in control (CT) and IFT88-depleted cells before and after k-fiber laser ablation. The 3 s time-point after ablation is shown. Single planes are shown. Insets: magnification of the ablated k-fibers, dashed boxes regions. Hoechst live was used to identify k-fibers attached to chromosomes. Line scans (right) representing NuMA and α-tubulin fluorescence intensities, measured from a to b (control) or from c to d (siRNA IFT88) along the yellow line (left inset on the image), show an accumulation of NuMA at minus-ends of k-fibers after laser ablation in CT cells but not in IFT88-depleted cells. Scale bars: 5 μm. ( b ) Percentage of cells with ablated k-fibers associated with NuMA enrichment. n ≥ 29 ablated k-fibers (1 ablated k-fiber per cell), 3 experiments. Mean +/− s.d. ** P < 0.01 compared to control ( t test). ( c ) Quantification of NuMA fluorescence intensity at minus-ends of MT after laser ablation. n ≥ 22 cells, 2 experiments. Mean +/− s.e.m. * P < 0.05 compared to control ( t test). ( d ) Line scans of IFT88 and NuMA fluorescence intensities overtime at the minus-end of k-fibers after laser ablation. x: pre-ablation; black arrow indicates the time of ablation. ( e ) Endogenous immunoprecipitation of IFT88 performed on LLC-PK1 cells (nocodazole + 3 min washout) shows an interaction with NuMA. Scale bars: 5 μm.
Article Snippet:
Techniques: Time-lapse Microscopy, Control, Fluorescence, Immunoprecipitation

Journal: Scientific Reports
Article Title: IFT88 controls NuMA enrichment at k-fibers minus-ends to facilitate their re-anchoring into mitotic spindles
doi: 10.1038/s41598-019-46605-x
Figure Lengend Snippet: IFT88 contributes to k-fibers reincorporation into spindle after nocodazole washout and is required for proper chromosomes alignment. ( a ) Immunofluorescence images of GFP-α-tubulin LLC-PK1 upon nocodazole treatment followed by 5 min washout showing defects in k-fibers reincorporation into the main spindle in IFT88-depleted cells compared to control. α-tubulin and α-tubulin/DNA stainings are shown (left panel). Percentage of mitotic cells with disorganized spindles or misaligned chromosomes upon nocodazole washout (right panel). n > 300 mitotic cells. 3 experiments. Mean +/− s.d. *** P < 0.001 compared to control ( t test). ( b ) Immunofluorescence images of GFP-α-tubulin LLC-PK1 cells upon nocodazole treatment followed by 2 min washout showing defects in NuMA minus-ends localization in IFT88-depleted cells. NuMA and α-tubulin/NuMA stainings are shown (left panel). Insets: magnified dashed boxes regions. Quantification of NuMA fluorescence intensity at the minus-ends of acentrosomal microtubule asters upon nocodazole washout in control and IFT88-depleted cells (right panel). n ≥ 15 cells per condition and n ≥ 73 acentrosomal microtubule asters per condition, 1 experiment shown, representative of 2 experiments. Mean +/− s.e.m. * P < 0.05 compared to control ( t test). ( c ) Images from time-lapse microscopy of LLC-PK1 GFP-α-tubulin/mCherry-H2B cells showing defects in spindle organization and chromosomes alignment in IFT88-depleted cells compared to control upon nocodazole washout. Time after washout (min). ( d ) Immunofluorescence images of GFP-α-tubulin LLC-PK1 cells showing defects in chromosomes alignment (without nocodazole challenge) upon IFT88 depletion. α-tubulin/DNA staining is shown (left). Quantification (right): percentage of mitotic cells with misaligned chromosomes (siRNA control, IFT88 and IFT88 #2 as indicated). n > 100 mitotic cells. 3 experiments. Mean +/− s.d. ** P < 0.01 compared to control ( t test). ( e ) Immunofluorescence images (left) showing α-tubulin and DNA stainings in HCT116-AID-IFT88 cells. Control (No auxin) and auxin (30 h)-induced AID-YFP-IFT88 degradation conditions are shown. Quantification (middle): percentage of mitotic cells with misaligned chromosomes upon auxin treatment (30 h). n > 50 mitotic cells. 3 experiments. Mean +/− s.e.m * P < 0.05 compared to control ( t test). Western-blots (right) showing AID-YFP-IFT88 depletion in HCT116 cells upon auxin treatment. α-tubulin: loading control. In all panels, maximum projections are shown, scale bars: 5 or 10 μm.
Article Snippet:
Techniques: Immunofluorescence, Control, Fluorescence, Time-lapse Microscopy, Staining, Western Blot
Journal: Integrative Organismal Biology
Article Title: Regeneration and Musculature in Halved Cassiopea xamachana Ephyrae
doi: 10.1093/iob/obaf030
Figure Lengend Snippet: Stereo microscope pictures of C. xamachana ephyrae showing growth of intact and bisected ephyrae. (A) Trajectory of growth in the original ephyra with photographs at days 0, 7, 14, 21, and 28. (B) Visual progress of two fragments with circle back comparison to original medusa, all are on the same scale (see scale bar). Locations of rhopalia are pinpointed with black dots, edges of the bell and oral arms are outlined in black. See description of one ephyra regeneration and development in .
Article Snippet: Ephyrae were then washed in PBS, mounted on a slide and imaged using a
Techniques: Microscopy, Comparison

Journal: Integrative Organismal Biology
Article Title: Regeneration and Musculature in Halved Cassiopea xamachana Ephyrae
doi: 10.1093/iob/obaf030
Figure Lengend Snippet: Confocal microscope images of actin-stained regenerating ephyrae at timepoints 0 and 24 h after bisection. (A) T (time) = 0 h post amputation (hpa); (B) T = 24 hpa after cut; (C) Close up of the wound site at T = 24 hpa. Scale bar A, B = 1 mm. Scale bar C = 50 µm. See for T = 48 hpa and T = 72 hpa.
Article Snippet: Ephyrae were then washed in PBS, mounted on a slide and imaged using a
Techniques: Microscopy, Staining
Journal: bioRxiv
Article Title: A multi-kingdom genetic barcoding system for precise target clone isolation
doi: 10.1101/2023.01.18.524633
Figure Lengend Snippet: ( A ) Conceptual diagram of retrospective clone isolation. ( B ) Different barcode-specific gRNA-dependent reporter activation circuits. CloneSelect C→T, low-copy CRISPRa, and high-copy CRISPRa. ( C ) Flow cytometry analysis of single-cell EGFP activation levels. ( D ) Barcode-dependent reporter activation of six barcoded cell lines by CloneSelect C→T. Scale bar, 50 μm. ( E ) Comparison of CloneSelect C→T, low-copy CRISPRa, and high-copy CRISPRa across the same barcode-gRNA pairs (n=3). For each approach, Welch’s t-test was performed to compare on-target (OT) and non-target (NT) activations. ( F ) CloneSelect A→G. ( G ) Comparison of CloneSelect A→G, low-copy CRISPRa, and high-copy CRISPRa across the same barcode-gRNA pairs (n=3). Welch’s t-test was performed to compare OT and NT activations. ( H ) ROC curves along varying EGFP intensity thresholds for target barcoded cells. Left, CloneSelect C→T and low-copy CRISPRa by the same targeting gRNAs. Right, CloneSelect A→G and low-copy CRISPRa for the same set of targeting gRNAs. ( I ) Performance comparison of CloneSelect C→T and CloneSelect A→G. Activated cell frequencies of OT and NT barcodes were normalized by activated cell frequencies of OT barcodes conferred by low-copy CRISPRa using the same targeting gRNA. The Mann-Whitney U test was performed to compare the two groups of datasets. * P < 0.05; ** P < 0.01; *** P < 0.001.
Article Snippet: To compare CloneSelect C→T and
Techniques: Isolation, Activation Assay, Flow Cytometry, MANN-WHITNEY

Journal: bioRxiv
Article Title: A multi-kingdom genetic barcoding system for precise target clone isolation
doi: 10.1101/2023.01.18.524633
Figure Lengend Snippet: ( A – C ) Barcode-specific gRNA-dependent activation of EGFP reporters for two barcoded HEK293T strains established for each of CloneSelect C→T ( A ), low-copy CRISPRa ( B ), and high-copy CRISPRa ( C ) (n=3). Scale bar, 50 μm. Welch’s t-test was performed to compare on-target (OT) and non-target (NT) activations. ( D ) Median EGFP intensities of genome editing-activated EGFP positive cells (n=3). The Mann-Whitney U test was performed to compare two groups. ( E ) Comparison of Target-AID variants and a nCas9 (D10A) control in the CloneSelect C→T reporter activation for the same set of barcode-gRNA pairs (n=1). Welch’s t-test was performed to compare OT and NT activations. ( F ) Reporter activation in HeLa cells by CloneSelect C→T (n=3). Welch’s t-test was performed to compare OT and NT activations. Scale bar, 80 μm. * P < 0.05; ** P < 0.01; *** P < 0.001.
Article Snippet: To compare CloneSelect C→T and
Techniques: Activation Assay, MANN-WHITNEY

Journal: bioRxiv
Article Title: A multi-kingdom genetic barcoding system for precise target clone isolation
doi: 10.1101/2023.01.18.524633
Figure Lengend Snippet: ( A and B ) Barcode-specific gRNA-dependent reporter activation of six barcoded cell lines prepared for each of low-copy CRISPRa and high-copy CRISPRa. Scale bar, 50 μm. ( C ) Median EGFP intensities of genome editing-activated EGFP positive cells (n=3). ( D ) ROC curves along varying reporter intensity thresholds for target barcoded cells. CloneSelect C→T, low-copy CRISPRa, and high-copy CRISPRa were examined for the common set of six barcodes. The Mann-Whitney U test was performed to compare two groups (* P < 0.05; ** P < 0.01; *** P < 0.001). ( E ) Frequencies of CloneSelect C→T reporter-activated cells obtained by transfection of different DNA amounts of barcode-targeting genome editing reagents. ( F ) ROC curve for each input DNA amount along varying reporter intensity thresholds for target barcoded cells.
Article Snippet: To compare CloneSelect C→T and
Techniques: Activation Assay, MANN-WHITNEY, Transfection

Journal: bioRxiv
Article Title: A multi-kingdom genetic barcoding system for precise target clone isolation
doi: 10.1101/2023.01.18.524633
Figure Lengend Snippet: ( A ) Different mCherry reporter variants tested to establish CloneSelect C→T. ( B and C ) mCherry expression from the different reporter variants with the first codon as GTG or ATG. Scale bar, 50 μm. ( D ) Activation of the M1V (GTG)+Δ2-9 mutant reporter with OT and NT gRNAs (n=3). Scale bar, 100 μm.
Article Snippet: To compare CloneSelect C→T and
Techniques: Expressing, Activation Assay, Mutagenesis

Journal: bioRxiv
Article Title: A multi-kingdom genetic barcoding system for precise target clone isolation
doi: 10.1101/2023.01.18.524633
Figure Lengend Snippet: ( A – C ) Barcodespecific gRNA-dependent reporter activation of three barcoded cell lines prepared for each of CloneSelect A→G, low-copy CRISPRa, and high-copy CRISPRa. Scale bar, 50 μm. ( D – F ) Flow cytometry analysis of single-cell EGFP activation levels. ( G ) Median EGFP intensities of genome editing-activated EGFP positive cells (n=3). The Mann-Whitney U test was performed to compare two groups (* P < 0.05; ** P < 0.01; *** P < 0.001). ( H ) ROC curves along varying reporter intensity thresholds for target barcoded cells (n=3).
Article Snippet: To compare CloneSelect C→T and
Techniques: Activation Assay, Flow Cytometry, MANN-WHITNEY

Journal: bioRxiv
Article Title: A multi-kingdom genetic barcoding system for precise target clone isolation
doi: 10.1101/2023.01.18.524633
Figure Lengend Snippet: ( A ) Nucleotide compositions of barcodes in the mammalian CloneSelect C→T plasmid mini-pool. Five barcodes that had unexpected lengths were excluded from this visualization. The full barcode sequence list can be found in Table S1. ( B ) Barcode abundances in the cell population labeled by the mini-lentiviral barcode pool of CloneSelect C→T. ( C ) gRNA-dependent labeling of target barcoded cells in a population. ( D ) Flow cytometry cell sorting of reporter-activated cells. ( E ) Barcode enrichment analysis after cell sorting of the reporter-activated cells. Each row represents the barcode enrichment profile for each target isolation assay.
Article Snippet: To compare CloneSelect C→T and
Techniques: Plasmid Preparation, Sequencing, Labeling, Flow Cytometry, FACS, Isolation
Journal: bioRxiv
Article Title: A multi-kingdom genetic barcoding system for precise target clone isolation
doi: 10.1101/2023.01.18.524633
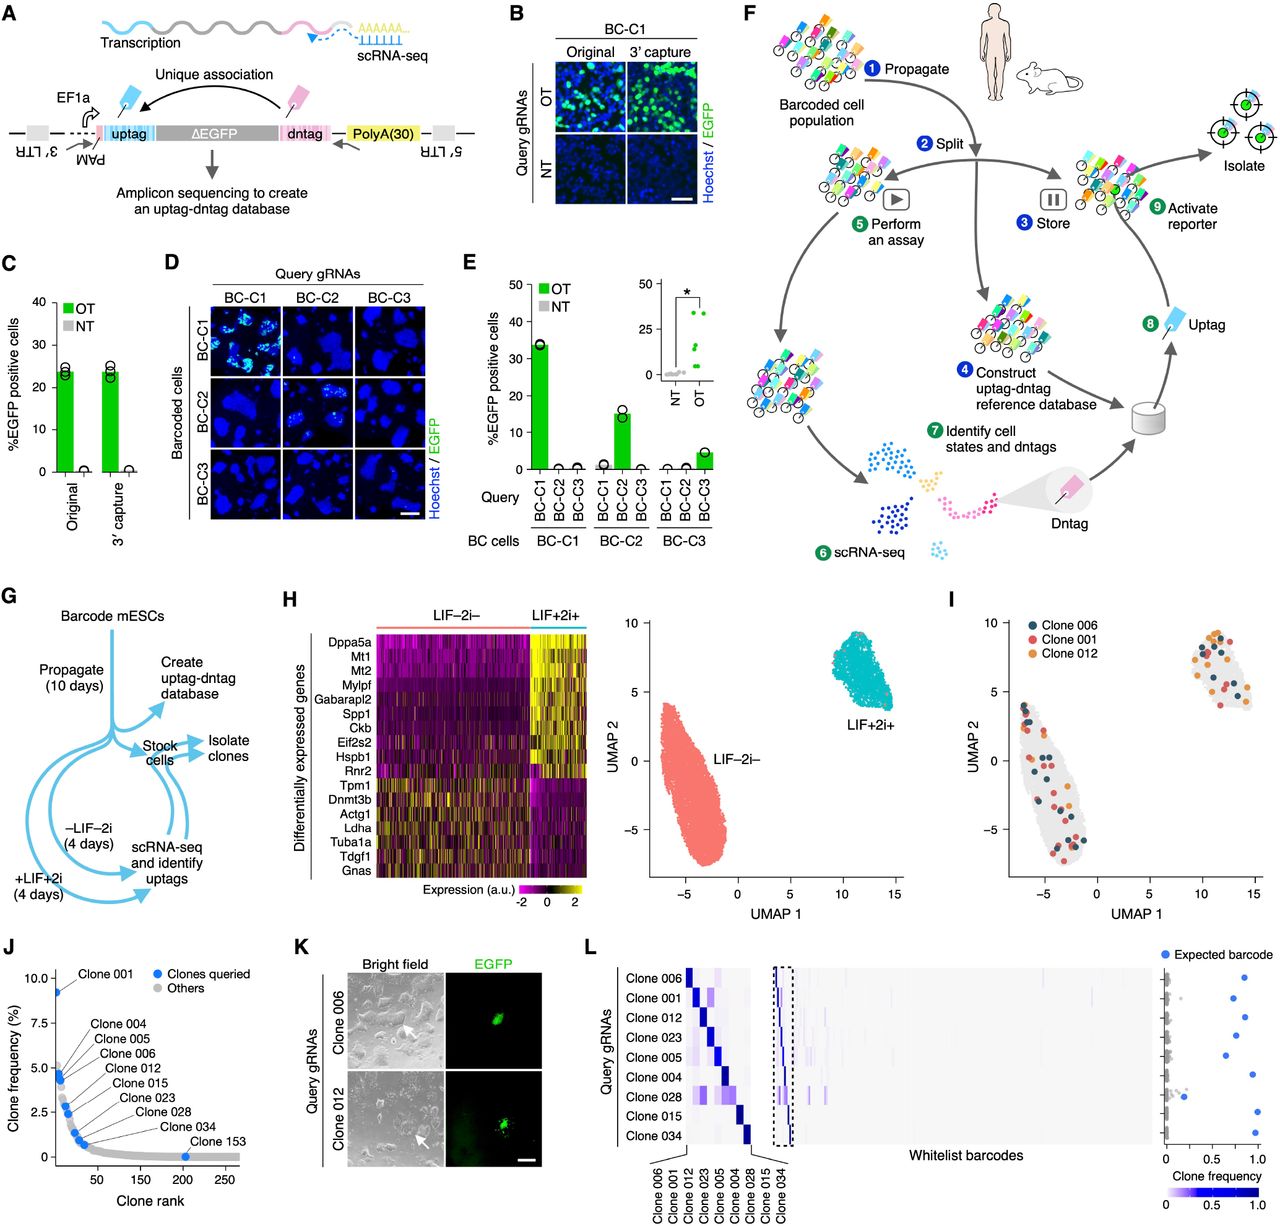
Figure Lengend Snippet: ( A ) scCloneSelect. ( B and C ) Barcode-specific gRNA-dependent reporter activation of the original CloneSelect C→T and scCloneSelect in HEK293T cells (n=3). Scale bar, 50 μm. ( D and E ) Barcode-specific gRNA-dependent reporter activation of three barcoded mESC lines by scCloneSelect. Target-AID was stably integrated prior to the barcoding. gRNAs were delivered by lentiviral transduction. Scale bar, 100 μm. Welch’s t-test was performed to compare on-target (OT) and non-target (NT) activations. * P < 0.05; ** P < 0.01; *** P < 0.001. ( F ) Schematic diagram of a scCloneSelect workflow to retrospectively isolate a cell clone demonstrating a gene expression profile of interest from a cell population stored before they demonstrate the target gene expression pattern. ( G ) mESC cell culture assays and clone isolation performed in this work. ( H ) scRNA-seq of mESC populations treated with LIF and 2i and those without LIF or 2i. ( I ) Distribution of cells for arbitrarily selected clones in the two-dimensional embedding of high-dimensional gene expression space by UMAP (uniform manifold approximation and projection). ( J ) Abundance of barcoded cell clones in the mESC population. The data was generated based on dntags identified by reamplifying the dntag reads from the original scRNA-seq libraries. ( K ) gRNA-specific activation of target barcoded clones in the mESC population. Scale bar, 50 μm. ( L ) Barcode enrichment analysis after cell sorting of the reporter-activated cells. Each row represents the barcode enrichment profile for each target isolation assay. The left heatmap was expanded from the dashed box area of the right heatmap.
Article Snippet: To compare CloneSelect C→T and
Techniques: Activation Assay, Stable Transfection, Transduction, Expressing, Cell Culture, Isolation, Clone Assay, Generated, FACS

Journal: bioRxiv
Article Title: A multi-kingdom genetic barcoding system for precise target clone isolation
doi: 10.1101/2023.01.18.524633
Figure Lengend Snippet: ( A ) EGFP-positive control expressions for the original CloneSelect C→T and scCloneSelect in HEK293T cells with the same genome editing conditions tested for the respective reporters (n=3). Scale bar, 50 μm. ( B ) Median EGFP intensities of base editing-activated EGFP positive cells (n=3). ( C and D ) Barcode-specific gRNA-dependent reporter activation of six barcoded cell lines by scCloneSelect (n=1). Welch’s t-test was performed to compare on-target (OT) and non-target (NT) activations (* P < 0.05; ** P < 0.01; *** P < 0.001). Scale bar, 50 μm. ( E ) RT-PCR of the scCloneSelect dntags in HEK293T. ( F ) Fraction of mESC single-cell transcriptome profiles (Drop-seq) that contained dntags and fraction of dntags reported in the uptag-dntag combination reference database. ( G ) Schematic representation of a scCloneSelect reporter activation assay where Target-AID was stably introduced to the cell population prior to barcoding and gRNA-dependent reporter activation. ( H and I ) gRNA-dependent reporter activation of target barcoded mESCs and CA1 hPSCs by scCloneSelect (n=2). Target-AID was stably integrated prior to the barcoding. Targeting gRNAs were delivered by transfection. Welch’s t-test was performed to compare OT and NT activations (* P < 0.05; ** P < 0.01; *** P < 0.001). Scale bar, 100 μm. ( J ) Schematic representation of a scCloneSelect reporter activation assay where the target gRNA and Target-AID were electroporated together to the barcoded cell population. ( K ) gRNA-dependent reporter activation of barcoded H1 hPSCs by scCloneSelect (n=2). Targeting gRNA and Target-AID were electroporated together. Scale bar, 100 μm.
Article Snippet: To compare CloneSelect C→T and
Techniques: Positive Control, Activation Assay, Reverse Transcription Polymerase Chain Reaction, Stable Transfection, Transfection

Journal: bioRxiv
Article Title: A multi-kingdom genetic barcoding system for precise target clone isolation
doi: 10.1101/2023.01.18.524633
Figure Lengend Snippet: ( A ) Yeast CloneSelect C→T circuit. ( B and C ) Barcode-specific gRNA-dependent reporter activation. Scale bar, 25 μm. Mean mCherry intensity measured by a plate reader was normalized by OD 595 nm (n=3). Welch’s t-test was performed to compare on-target (OT) and non-target (NT) activities. ( D ) GTG→ATG editing frequencies observed by high-throughput sequencing. Welch’s t-test was performed to compare OT and NT datasets. ( E ) Yeast colonies formed on a 10-cm agar plate after performing a target clone labeling in the yeast cell population of Pool-100. ( F–J ) Analysis of colonies isolated after clone labeling using each targeting gRNA. ( F ) mCherry positive isolates from Pool-100. ( G ) mCherry negative isolates from Pool-100. ( H ) mCherry positive isolates from Pool-1580. ( I ) mCherry negative isolates from Pool-1580. ( J ) Summary of the analysis results. * P < 0.05; ** P < 0.01; *** P < 0.001.
Article Snippet: To compare CloneSelect C→T and
Techniques: Activation Assay, Next-Generation Sequencing, Labeling, Isolation

Journal: bioRxiv
Article Title: A multi-kingdom genetic barcoding system for precise target clone isolation
doi: 10.1101/2023.01.18.524633
Figure Lengend Snippet: ( A ) Different mCherry reporter variants tested to establish CloneSelect C→T. The different reporter variants were tested with the first codon as GTG or ATG. Scale bar, 100 μm. ( B ) Canavanine resistance assays for different CRISPR genome editing enzymes with a gRNA targeting CAN1 gene and a control NT gRNA. For each experiment, cell concentration was normalized to 1.0 OD 595 nm and serially diluted with 10-fold increments for spotting. ( C ) Estimated CFU counts for the same assay in ( B ). ( D ) Genome editing outcomes observed by amplicon sequencing. Frequencies of mutation patterns observed across the target sequence region are shown for the same assay in ( B ). ( E ) Genome editing frequencies at the target CAN1 locus estimated by amplicon sequencing for the different enzymes. ( F ) Activation of the mCherry M1V (GTG)+Δ2-9 mutant reporter by OT and NT gRNAs. Scale bar, 200 μm. ( G ) mCherry-positive control expressions for yeast CloneSelect. Yeast cells having the positive control reporters with three different barcodes (BC-C1, BC-C2, and BC-C3) were each treated by Target-AID and three different targeting gRNAs. Scale bar, 25 μm.
Article Snippet: To compare CloneSelect C→T and
Techniques: CRISPR, Concentration Assay, Amplification, Sequencing, Mutagenesis, Activation Assay, Positive Control

Journal: bioRxiv
Article Title: A multi-kingdom genetic barcoding system for precise target clone isolation
doi: 10.1101/2023.01.18.524633
Figure Lengend Snippet: ( A ) Bacterial CloneSelect A→G circuit. ABE and gRNA expressions were controlled by IPTG-inducible promoters, and the EGFP reporter expression was controlled by an arabinose-inducible promoter. ( B and C ) EGFP reporter activation of E. coli cells under different inducer conditions. Scale bar, 25 μm. Mean EGFP intensity measured by a plate reader was normalized by OD 595 nm (n=3). Welch’s t-test was performed to compare on-target (OT) and non-target (NT) activities. ( D ) Base editing outcomes analyzed by Sanger sequencing. ( E ) Activities of the positive control EGFP reporter under the same conditions tested for (C) (n=3). Welch’s t-test was performed to compare OT and NT activities. ( F ) Zeocin resistance marker-based circuit. ( G ) Barcode-specific gRNA-dependent Zeocin resistance reporter activation. ( H ) Schematic diagram of a bacterial CloneSelect workflow using a drug selective condition for the target barcoded cell isolation. ( I ) Abundance of barcoded cells in Pool-100 and Pool-1550. ( J ) Colonies formed on Zeocin-selective and non-selective solid agar plates after performing the reporter activation of Clone 106 in the E. coli cell population of Pool-100. ( K ) Analysis of colonies isolated from Zeocin selective and non-selective plates obtained after clone labeling using each targeting gRNA. * P < 0.05; ** P < 0.01; *** P < 0.001.
Article Snippet: To compare CloneSelect C→T and
Techniques: Expressing, Activation Assay, Sequencing, Positive Control, Marker, Cell Isolation, Isolation, Labeling

Journal: bioRxiv
Article Title: A multi-kingdom genetic barcoding system for precise target clone isolation
doi: 10.1101/2023.01.18.524633
Figure Lengend Snippet: ( A ) Activities of the positive control EGFP reporter. ABE and gRNA expression were controlled by an IPTG-inducible promoter, and the EGFP reporter expression was controlled by an arabinose-inducible promoter. ( B ) Base editing outcomes of the positive control reporters analyzed by Sanger sequencing. ( C ) Testing of Zeocin resistances conferred by two promoters expressing a Zeocin resistance gene with and without the upstream stop codon to block the selective marker translation. Each cell sample concentration was first adjusted to 0.1 OD 595 nm and serially diluted with 10-fold increments for spotting 5 μL. ( D ) Testing of cell viability under a non-selective condition for a constitutively active T7 promoter and the IPTG-inducible promoter to express the gRNA. OT and NT gRNAs were tested for the gRNA-dependent EGFP reporter and the positive control EGFP reporter. ABE was expressed under the IPTG-inducible promoter without IPTG provided. ( E ) gRNA-dependent Zeocin resistance reporter activation tested for the IPTG-inducible promoters with and without IPTG. ( F ) Bacterial CloneSelect using the Blasticidin resistance gene. Each cell sample concentration was first adjusted to 0.1 OD 595 nm and serially diluted with 10-fold increments for spotting 5 μL. ( G ) gRNA-dependent Blasticidin-resistance reporter activation tested for different inducer conditions and different Blasticidin concentrations. Each cell sample concentration was adjusted to 0.1 OD 595 nm for spotting 5 μL.
Article Snippet: To compare CloneSelect C→T and
Techniques: Positive Control, Expressing, Sequencing, Blocking Assay, Marker, Concentration Assay, Activation Assay

Journal: bioRxiv
Article Title: A multi-kingdom genetic barcoding system for precise target clone isolation
doi: 10.1101/2023.01.18.524633
Figure Lengend Snippet: ( A ) Three-gRNA-input OR gate with CloneSelect C→T that is designed to confer the EGFP reporter expression by any of the three barcode-specific gRNA-dependent GTG→ATG mutations. ( B ) Three-gRNA-input AND gate with CloneSelect A→G that is designed to confer the EGFP reporter expression when all three barcode-specific gRNA-dependent TAA→CAA mutations are provided.
Article Snippet: To compare CloneSelect C→T and
Techniques: Expressing